OUR METHOD

![kpi-[Convertito]@2x kpi-[Convertito]@2x](https://ivuedata.com/wp-content/uploads/2022/03/kpi-Convertito@2x.png)
INSIGHTS FROM HUNDREDS OR THOUSANDS OF USERS

PLAT SESSION

VISUALIZATION & DATA ANALISYS

VISUALIZATION & DATA ANALISYS
Stratmapper

Visualization Systems
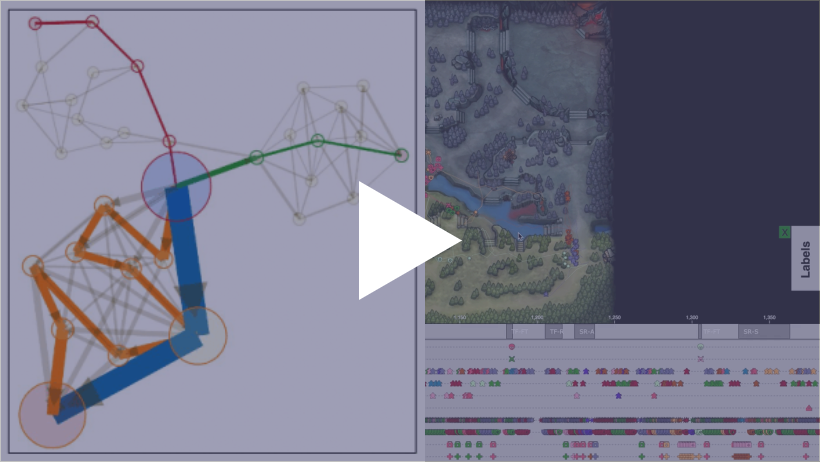
Glyph has an added feature of a window showing clustered patterns. This window is shown alongside the state-action transition graphs. When one selects a pattern from this window, the corresponding state-action transitions are shown. This allows analysts to navigate similar patterns and identify different ones. We will discuss this interface in more detail later. It should be noted that Glyph has been published in Nguyen, Seif El-Nasr, and Canossa (2015); we refer the readers to this article for more information.
Keynote Address at SBGames

Games, especially Serious Games, have, for many years, been used as applications for entertainment, education, training, crowdsourcing, as well as platforms for understanding human behavior, which creates opportunities for making great societal impacts. The potential social impact of these environments elevates the importance of developing methods that can enhance the player engagement during and after production as well as evaluate the value of these designs in the long term. Towards these goals, I will discuss various visualization and behavior analysis tools and innovative methods we have developed and used over the past decade. I will also discuss a case study where these tools and methods are used. I will discuss how these tools and methods enabled us to discover design problems that impacted players’ engagement, adherence, and motivation. I will then conclude by discussing results from our current studies investigating the use of user and data-centric approaches in current esports tools used for training and engagement.
CASE STUDIES


CASE STUDIES


